金蝶云苍穹通用图样例
原创约 2011 字大约 7 分钟...
73-金蝶云苍穹通用图样例.md
注意
本博文仅供学术研究和交流参考,严禁将其用于商业用途。如因违规使用产生的任何法律问题,使用者需自行负责。
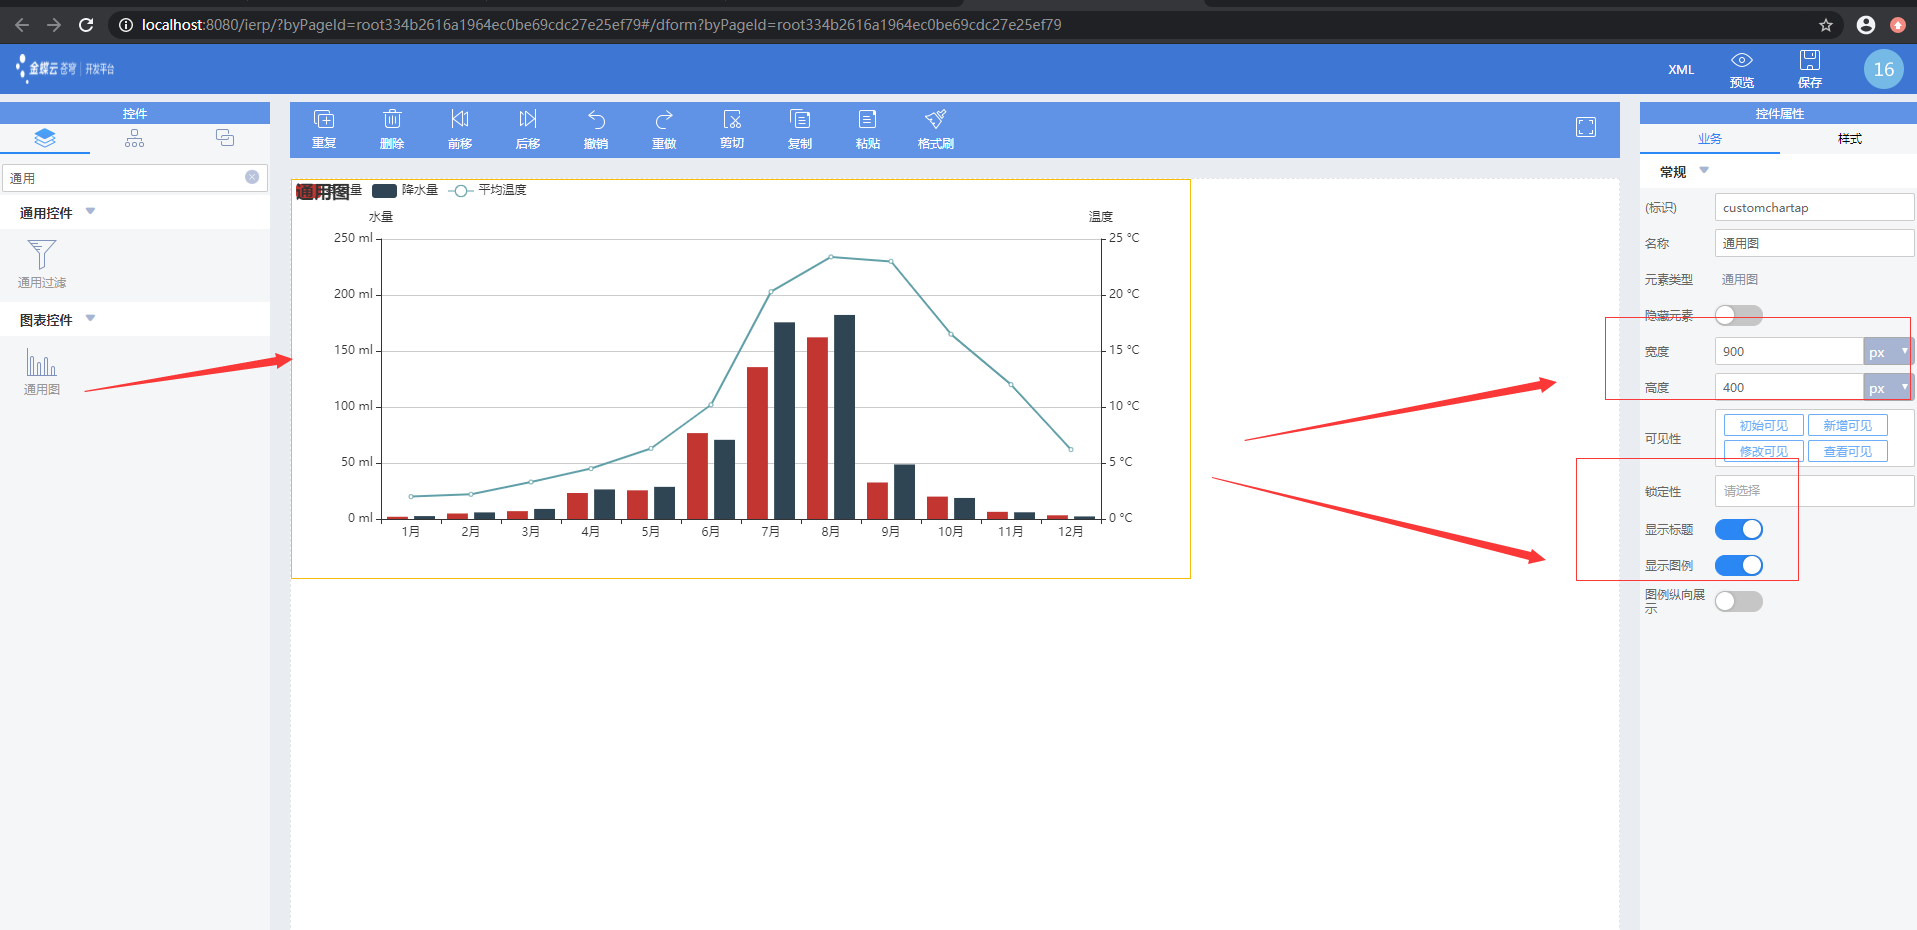
新建空白页面动态表单
在其添加柱状图,设置显示标题显示图例且设置宽高为900*400后保存

- 编码
package kd.bos.wzy.card;

import java.util.EventObject;

import kd.bos.form.chart.CustomChart;
import kd.bos.form.plugin.AbstractFormPlugin;

/**
 * <p>Title: </p>
 * <p>
 *    Description:
 * </p>
 * <p>Copyright: Copyright (c) 2020</p>
 * @author xx
 * @date 2020年3月11日
 * see_to_overridden
 * @version 1.0
 */
public class CustomChartPlugin extends AbstractFormPlugin {
	/**
	 * <p>Title: </p>
	 * <p>
	 *    Description:
	 * </p>
	 * <p>Copyright: Copyright (c) 2020</p>
	 * @author xx
	 * @date 2020年3月11日
	 * @param param the bare_field_name
	 * @param e
	 * @see kd.bos.entity.datamodel.events.IDataModelListener#afterCreateNewData(java.util.EventObject)
	 * @version 1.0
	 */
	@Override
	public void afterCreateNewData(EventObject e) {
		// TODO Auto-generated method stub
		super.afterCreateNewData(e);
		CustomChartAllHelper customChartHepler = new CustomChartAllHelper();
		// 获得通用图控件
		CustomChart customChart = this.getControl("customchartap");
		// 调用画布填充方法
		customChartHepler.drawChart(customChart);
	}
}
package kd.bos.wzy.card;

import java.util.ArrayList;
import java.util.HashMap;
import java.util.Iterator;
import java.util.LinkedHashMap;
import java.util.List;
import java.util.Map;

import com.google.common.collect.Maps;

import kd.bos.form.chart.Axis;
import kd.bos.form.chart.AxisType;
import kd.bos.form.chart.BarSeries;
import kd.bos.form.chart.ChartType;
import kd.bos.form.chart.CustomChart;
import kd.bos.form.chart.Label;
import kd.bos.form.chart.Position;

/**
 * <p>Title: </p>
 * <p>
 *    Description:
 * </p>
 * <p>Copyright: Copyright (c) 2020</p>
 * @author xx
 * @date 2020年3月11日
 * see_to_overridden
 * @version 1.0
 */
public class CustomChartAllHelper {

	private CustomChart customChart;

	/**
	 * void</br>
	 *
	 * <p>Title: </p>
	 * <p>
	 *    Description:
	 *    画图
	 * </p>
	 * <p>Copyright: Copyright (c) 2020</p>
	 * @author xx
	 * @date 2020年3月11日
	 * @param param the bare_field_name
	 * @return the bare_field_name
	 * @param customChart
	 * see_to_overridden
	 * @version 1.0
	 */
	void drawChart(CustomChart customChart) {
		this.setCustomChart(customChart);
		// 清理通用图数据
		customChart.clearData();
		// 设置
		List<String> categorys = this.getSMonth();
		// 获得分析数量
		Map<Group, List<Number>> datas = this.getData();
		datas.forEach((group, data) -> {
			this.createBarSeries(group, data, "yAxisIndex");
		});
		// 设置默认图标显示
		this.setDefaultLegend();
		// 创建x轴
		Axis xAxis = this.createCategoryAxis("", true);
		// 创建y轴
		Axis yAxis = this.createValueAxis("水量", false);
		// 创建y2Axis
		Axis y2Axis = this.createValueAxis("温度", false);
		this.setAxisProp(xAxis, null, null, null, null);
		// 设置x轴数据
		xAxis.setCategorys(categorys);

		this.setAxisProp(yAxis, Position.right, "{value} ml", 50, 250);
		this.setAxisProp(y2Axis, Position.left, "{value} ℃", 5, 25);

		customChart.setLegendPropValue("itemWidth", Integer.valueOf(50));
		customChart.setLegendPropValue("itemHeight", Integer.valueOf(20));
		customChart.setLegendPropValue("top", "10");
		Map<String, Object> textStyle = new HashMap<String, Object>();
		textStyle.put("color", "#ffffff");
		textStyle.put("fontSize", 16);
		customChart.setLegendPropValue("textStyle", textStyle);
		// 设置图标边距
		customChart.setMargin(Position.right, "80px");
		customChart.setShowLegend(true);
		customChart.setMargin(Position.top, "60px");
		// 刷新图表
		customChart.refresh();

	}

	/**
	 * void</br>
	 *
	 * <p>Title: </p>
	 * <p>
	 *    Description:
	 * </p>
	 * <p>Copyright: Copyright (c) 2020</p>
	 * @author xx
	 * @date 2020年3月11日
	 * @param param the bare_field_name
	 * @return the bare_field_name
	 * @param axis
	 * @param position
	 * @param formatter
	 * @param interval
	 * @param max
	 * see_to_overridden
	 * @version 1.0
	 */
	private void setAxisProp(Axis axis, Position position, String formatter, Number interval, Number max) {
		// 设置轴数据显示格式
		Map<String, Object> axisLabel = Maps.newHashMap();
		axisLabel.put("formatter", formatter);
		axis.setPropValue("axisLabel", axisLabel);
		// 轴设置刻度
		axis.setPropValue("interval", interval);
		// 设置轴最大刻度
		axis.setMax(max);
		// 轴指示器属性
		Map<String, Object> AxisPointer = Maps.newHashMap();
		AxisPointer.put("show", true);
		AxisPointer.put("type", "line");
		// 轴文本标签设置
		Label AxisLabel = new Label();
		AxisLabel.setShow(true);
		AxisLabel.setBackgroundColor("black");
		AxisPointer.put("label", AxisLabel);
		// 轴设置指示线类型
		Map<String, Object> lineStyle = Maps.newHashMap();
		lineStyle.put("type", "dotted");
		AxisPointer.put("lineStyle", lineStyle);
		// 设置Y轴不触发悬浮提示信息
		AxisPointer.put("triggerTooltip", false);
		axis.setPosition(position);
		axis.setPropValue("axisPointer", AxisPointer);
	}

	/**
	 * Map<Group,List<Number>></br>
	 *
	 * <p>Title: </p>
	 * <p>
	 *    Description:
	 *    获取数据
	 * </p>
	 * <p>Copyright: Copyright (c) 2020</p>
	 * @author xx
	 * @date 2020年3月11日
	 * @param param the bare_field_name
	 * @return the bare_field_name
	 * @return
	 * see_to_overridden
	 * @version 1.0
	 */
	private Map<Group, List<Number>> getData() {
		// 用于储存结果数据
		Map<Group, List<Number>> results = new LinkedHashMap<Group, List<Number>>();
		// 获得默认分组
		List<Group> gList = this.getDefaultGroup();
		// 设置
		Iterator<Group> iter = gList.iterator();
		Number[] nq = { 2.0, 4.9, 7.0, 23.2, 25.6, 76.7, 135.6, 162.2, 32.6, 20.0, 6.4, 3.3 };
		Number[] nw = { 2.6, 5.9, 9.0, 26.4, 28.7, 70.7, 175.6, 182.2, 48.7, 18.8, 6.0, 2.3 };
		Number[] nc = { 2.0, 2.2, 3.3, 4.5, 6.3, 10.2, 20.3, 23.4, 23.0, 16.5, 12.0, 6.2 };
		while (iter.hasNext()) {// 组别
			Group g = iter.next();
			List<Number> sm = new ArrayList<Number>();// 月份
			if (g.groupKey.equals("Q")) {
				for (int i = 0; i < this.getSMonth().size(); i++) {
					sm.add(nq[i]);
				}
			}
			if (g.groupKey.equals("W")) {
				for (int i = 0; i < this.getSMonth().size(); i++) {
					sm.add(nw[i]);
				}
			}
			if (g.groupKey.equals("C")) {
				for (int i = 0; i < this.getSMonth().size(); i++) {
					sm.add(nc[i]);
				}
			}
			results.put(g, sm);
		}
		return results;
	}

	/**
	 * List<String></br>
	 *
	 * <p>Title: </p>
	 * <p>
	 *    Description:
	 *    获取月份类别数据
	 * </p>
	 * <p>Copyright: Copyright (c) 2020</p>
	 * @author xx
	 * @date 2020年3月11日
	 * @param param the bare_field_name
	 * @return the bare_field_name
	 * @return
	 * see_to_overridden
	 * @version 1.0
	 */
	private List<String> getSMonth() {
		List<String> months = new ArrayList<String>();
		StringBuilder s = null;
		int index = 0;
		for (int i = 0; i < 12; i++) {
			s = new StringBuilder();
			index = i + 1;
			s.append(index).append("月");
			months.add(s.toString());
		}
		return months;
	}

	/**
	 * Axis</br>
	 *
	 * <p>Title: </p>
	 * <p>
	 *    Description:
	 * </p>
	 * <p>Copyright: Copyright (c) 2020</p>
	 * @author xx
	 * @date 2020年3月11日
	 * @param param the bare_field_name
	 * @return the bare_field_name
	 * @param name
	 * @param isX true创建x轴,false创建y轴
	 * @return
	 * see_to_overridden
	 * @version 1.0
	 */
	private Axis createCategoryAxis(String name, boolean isX) {
		// TODO Auto-generated method stub
		Axis axis = null;
		if (isX) {
			// 如果是X轴
			axis = customChart.createXAxis(name, AxisType.category);
		} else {
			// Y轴
			axis = customChart.createYAxis(name, AxisType.category);
		}
		// 坐标轴刻度相关设置
		Map<String, Object> axisTick = new HashMap<>();
		// 坐标轴刻度的显示间隔为0
		axisTick.put("interval", 0);
		// 设置坐标轴的属性-刻度
		axis.setPropValue("axisTick", axisTick);
		// 设置坐标轴轴线颜色
		this.setLineColor(axis, "#ffffff");
		return axis;

	}

	/** Axis</br>
	 *
	 * <p>Title: </p>
	 * <p>
	 *    Description:
	 * </p>
	 * <p>Copyright: Copyright (c) 2020</p>
	 * @author xx
	 * @date 2020年3月11日
	 * @param param the bare_field_name
	 * @return the bare_field_name
	 * @param name 坐标轴名称
	 * @param isX 是否是x轴
	 * @return
	 * see_to_overridden
	 * @version 1.0
	 */
	private Axis createValueAxis(String name, boolean isX) {
		Axis axis = null;
		if (isX) {
			// X轴
			axis = customChart.createXAxis(name, AxisType.value);
		} else {
			// Y轴
			axis = customChart.createYAxis(name, AxisType.value);
		}
		// 坐标轴刻度相关设置
		Map<String, Object> axisTick = new HashMap<>();
		axis.setPropValue("axisTick", axisTick);
		Map<String, Object> splitLine = new HashMap<>();
		Map<String, Object> lineStyle = new HashMap<>();
		// 分隔线的类型
		lineStyle.put("type", "dotted");
		// 分隔线的颜色
		lineStyle.put("color", "#E2E2E2");
		splitLine.put("lineStyle", lineStyle);
		// 设置坐标轴的属性-分隔线
		axis.setPropValue("splitLine", splitLine);
		// 设置坐标轴轴线颜色
		this.setLineColor(axis, "#ffffff");
		// 显示悬浮提示框
		customChart.setShowTooltip(true);
		return axis;
	}

	/** void</br>
	 *
	 * <p>Title: </p>
	 * <p>
	 *    Description:
	 *    设置坐标轴轴线的颜色
	 * </p>
	 * <p>Copyright: Copyright (c) 2020</p>
	 * @author xx
	 * @date 2020年3月11日
	 * @param param the bare_field_name
	 * @return the bare_field_name
	 * @param axix 坐标轴对象
	 * @param color 颜色色值
	 * see_to_overridden
	 * @version 1.0
	 */
	private void setLineColor(Axis axix, String color) {
		Map<String, Object> axisLineMap = new HashMap<>();
		Map<String, Object> lineStyleMap = new HashMap<>();
		// 坐标轴轴线的颜色
		lineStyleMap.put("color", color);
		axisLineMap.put("lineStyle", lineStyleMap);
		// 设置坐标轴的属性-轴线
		axix.setPropValue("axisLine", axisLineMap);
	}

	/** void</br>
	 *
	 * <p>Title: </p>
	 * <p>
	 *    Description:
	 *    设置柱状图
	 * </p>
	 * <p>Copyright: Copyright (c) 2020</p>
	 * @author xx
	 * @date 2020年3月11日
	 * @param param the bare_field_name
	 * @return the bare_field_name
	 * @param group
	 * @param values
	 * @param AxisIndex
	 * see_to_overridden
	 * @version 1.0
	 */
	private void createBarSeries(Group group, List<Number> values, String AxisIndex) {
		BarSeries barSeries = customChart.createBarSeries(group.groupName);
		// 设置系列宽度
		barSeries.setBarWidth("20px");
		// 设置系列颜色
		barSeries.setColor(group.color);
		// 动画过度时间
		barSeries.setAnimationDuration(2000);
		// 设置图类型
		barSeries.setType(group.type);
		Label label = barSeries.getLabel();// 获取label
		label.setShow(false);// #1771eb
		barSeries.setLabel(label);
		// 设置系列之间的间隔
		barSeries.setPropValue("barGap", "15%");
		// 设置类别之间的间隔
		barSeries.setPropValue("barCategoryGap", "15%");
		// 设置所属坐标
		if (AxisIndex.equals("xAxisIndex")) {
			barSeries.setPropValue("xAxisIndex", group.xAxisIndex);
		} else {
			barSeries.setPropValue("yAxisIndex", group.yAxisIndex);
		}
		// 设置类别对应的数据包
		barSeries.setData((Number[]) values.toArray(new Number[0]));
	}

	/** List<Group></br>
	 *
	 * <p>Title: </p>
	 * <p>
	 *    Description:
	 *    获取默认分组
	 * </p>
	 * <p>Copyright: Copyright (c) 2020</p>
	 * @author xx
	 * @date 2020年3月11日
	 * @param param the bare_field_name
	 * @return the bare_field_name
	 * @return
	 * see_to_overridden
	 * @version 1.0
	 */
	private List<Group> getDefaultGroup() {
		List<Group> defaultGroup = new ArrayList<>(3);
		defaultGroup.add(new Group("蒸发量", "Q", "#030303", true, ChartType.bar, 0, 0));
		defaultGroup.add(new Group("降水", "W", "#CD0000", true, ChartType.bar, 0, 0));
		defaultGroup.add(new Group("平均温度", "C", "#EEEE00", true, ChartType.line, 1, 0));
		return defaultGroup;

	}

	/** void</br>
	 *
	 * <p>Title: </p>
	 * <p>
	 *    Description:
	 *    设置图例
	 * </p>
	 * <p>Copyright: Copyright (c) 2020</p>
	 * @author xx
	 * @date 2020年3月11日
	 * @param param the bare_field_name
	 * @return the bare_field_name
	 * see_to_overridden
	 * @version 1.0
	 */
	private void setDefaultLegend() {
		Map<String, Boolean> selected = new HashMap<String, Boolean>();
		for (Group group : this.getDefaultGroup()) {
			selected.put(group.groupName, group.selected);
		}
		customChart.setLegendPropValue("selected", selected);
	}

	/**
	 * <p>Title: </p>
	 * <p>
	 *    Description:
	 *    分组实体类
	 * </p>
	 * <p>Copyright: Copyright (c) 2020</p>
	 * @author xx
	 * @date 2020年3月11日
	 * see_to_overridden
	 * @version 1.0
	 */
	class Group {
		// 组名
		String groupName;
		// 组别key
		String groupKey;
		// 组别显示颜色
		String color;
		// 是否是选中
		Boolean selected;
		// 展示类型 柱形,折线
		ChartType type;
		// 所属轴标识,这里用多个y轴
		Integer yAxisIndex;
		// 所属轴标识,这里多用在多个x轴
		Integer xAxisIndex;

		public Group(String groupName, String groupKey, String color, Boolean selected, ChartType type,
				Integer yAxisIndex, Integer xAxisIndex) {
			super();
			this.groupName = groupName;
			this.groupKey = groupKey;
			this.color = color;
			this.selected = selected;
			this.type = type;
			this.yAxisIndex = yAxisIndex;
			this.xAxisIndex = xAxisIndex;
		}
	}

	/**
	 * CustomChart</br>
	 *
	 * <p>Title: </p>
	 * <p>
	 *    Description:
	 * </p>
	 * <p>Copyright: Copyright (c) 2020</p>
	 * @author xx
	 * @date 2020年3月11日
	 * @param param the bare_field_name
	 * @return the bare_field_name
	 * @return
	 * see_to_overridden
	 * @version 1.0
	 */
	public CustomChart getCustomChart() {
		return customChart;
	}

	/**
	 * void</br>
	 *
	 * <p>Title: </p>
	 * <p>
	 *    Description:
	 * </p>
	 * <p>Copyright: Copyright (c) 2020</p>
	 * @author xx
	 * @date 2020年3月11日
	 * @param param the bare_field_name
	 * @return the bare_field_name
	 * @param customChart
	 * see_to_overridden
	 * @version 1.0
	 */
	public void setCustomChart(CustomChart customChart) {
		this.customChart = customChart;
	}
}
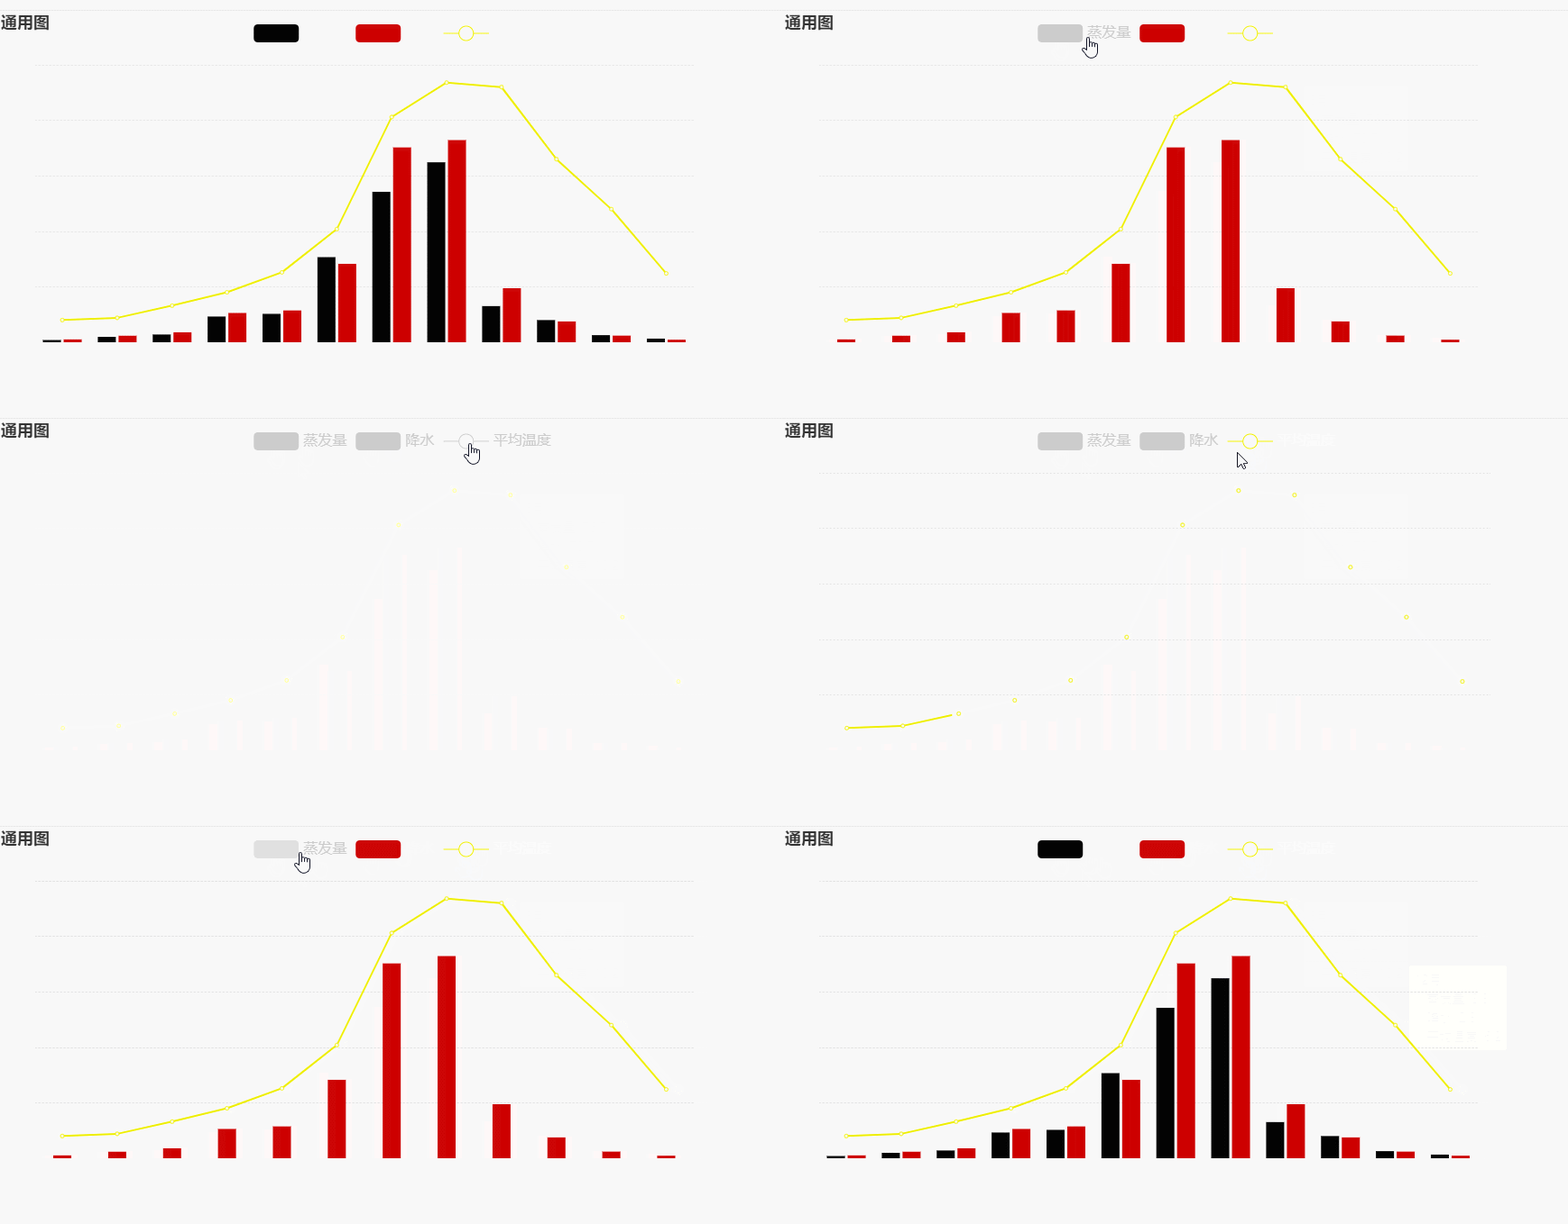
- 重启服务器后注册插件预览测试,如下图所示测试成功

分割线
相关信息
以上就是我关于 金蝶云苍穹通用图样例 知识点的整理与总结的全部内容,希望对你有帮助。。。。。。
Powered by Waline v2.15.4