金蝶云苍穹柱状图样例
原创约 1933 字大约 6 分钟...
71-金蝶云苍穹柱状图样例.md
注意
本博文仅供学术研究和交流参考,严禁将其用于商业用途。如因违规使用产生的任何法律问题,使用者需自行负责。
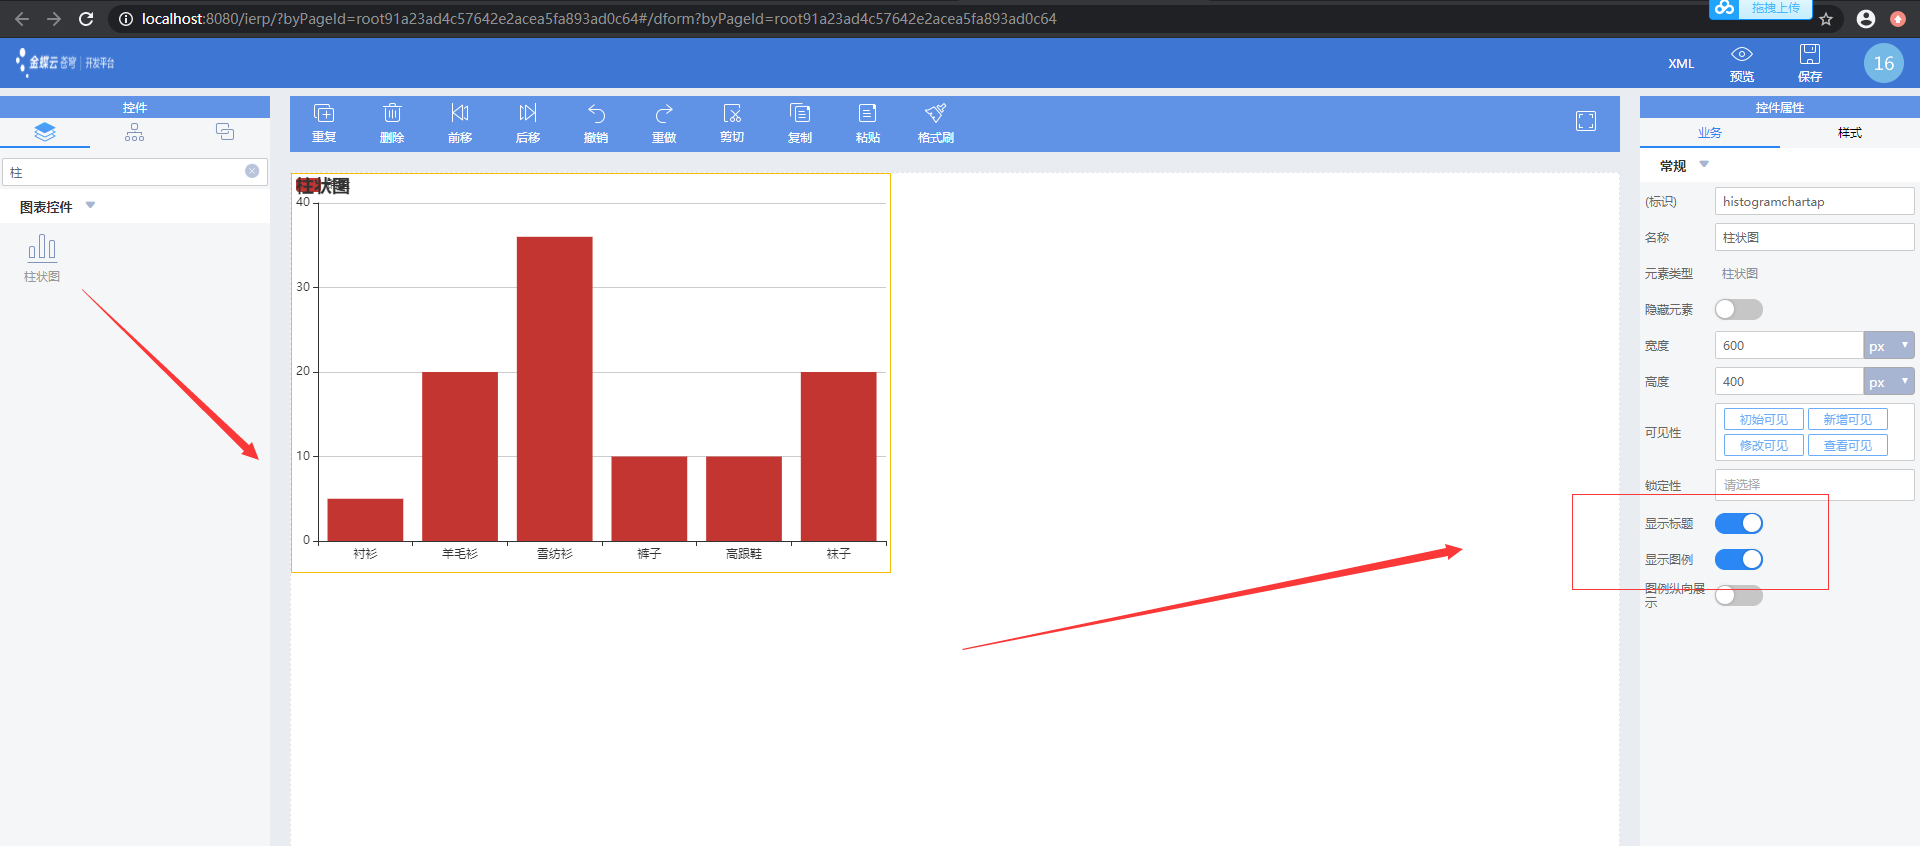
新建空白页面动态表单
在其添加柱状图,且设置宽高为600*400后保存
- 编码
package kd.bos.card.plugin;

import java.util.ArrayList;
import java.util.EventObject;
import java.util.HashMap;
import java.util.LinkedHashMap;
import java.util.List;
import java.util.Map;

import com.google.common.collect.Maps;

import kd.bos.dataentity.utils.StringUtils;
import kd.bos.form.chart.Axis;
import kd.bos.form.chart.AxisType;
import kd.bos.form.chart.BarSeries;
import kd.bos.form.chart.ChartType;
import kd.bos.form.chart.HistogramChart;
import kd.bos.form.chart.Label;
import kd.bos.form.chart.Position;
import kd.bos.form.plugin.AbstractFormPlugin;

/**
 * <p>Title: </p>
 * <p>
 *    Description:
 * </p>
 * <p>Copyright: Copyright (c) 2020</p>
 * @author xx
 * @date 2020年3月11日
 * see_to_overridden
 * @version 1.0
 */
public class HistogramTest01 extends AbstractFormPlugin {
	/**
	 * <p>Title: </p>
	 * <p>
	 *    Description:
	 * </p>
	 * <p>Copyright: Copyright (c) 2020</p>
	 * @author xx
	 * @date 2020年3月11日
	 * @param param the bare_field_name
	 * @param e
	 * @see kd.bos.entity.datamodel.events.IDataModelListener#afterCreateNewData(java.util.EventObject)
	 * @version 1.0
	 */
	@Override
	public void afterCreateNewData(EventObject e) {
		// TODO Auto-generated method stub
		super.afterCreateNewData(e);
		this.drawChart();
	}

	/**
	 * void</br>
	 *
	 * <p>Title: </p>
	 * <p>
	 *    Description:
	 * </p>
	 * <p>Copyright: Copyright (c) 2020</p>
	 * @author xx
	 * @date 2020年3月11日
	 * @param param the bare_field_name
	 * @return the bare_field_name
	 * @version 1.0
	 */
	public void drawChart() {
		HistogramChart customchart = this.getMainChart();
		customchart.clearData(); // 清除数据 避免重复增加数据
		// customchart.setShowLegend(false); //图例
		// customchart.setShowTitle(false); //标题

		// 设置图形的位置
		customchart.setMargin(Position.right, "80");

		// 设置图例
		customchart.setShowLegend(true);
		// customchart.setLegendPropValue("left", 1000);
		// customchart.setLegendPropValue("top", 0);
		// customchart.setLegendPropValue("itemWidth", 8);
		// customchart.setLegendPropValue("itemHeight", 8);

		// true纵向显示 false不纵向显示
		customchart.setLegendVertical(false);

		// 获取默认x轴数据
		List<String> materiaName = this.getMateriaName();

		// 设置柱状图类别数据
		Map<Group, List<Number>> sortedData = this.getData02(materiaName);

		// 利用lambda表达式遍历sortedData
		sortedData.forEach((group, data) -> {
			this.createBarSeries(group, data);
		});
		// 创建X轴
		Axis xAxis = this.createCategoryAxis("", true);
		// 设置X轴坐标数据
		xAxis.setCategorys(materiaName);
		// X轴指示器属性设置
		Map<String, Object> xAxisPointer = Maps.newHashMap();
		xAxisPointer.put("show", true);
		xAxisPointer.put("type", "shadow");
		// X轴文本标签设置
		Label xAxisLabel = new Label();
		// 显示文本标签
		xAxisLabel.setShow(true);
		// 背景色黑色
		xAxisLabel.setBackgroundColor("black");
		// xAxisPointer.put("nameGap", "2");
		xAxisPointer.put("label", xAxisLabel);
		// 坐标轴名字
		xAxis.setName("物料名称");
		xAxis.setPropValue("axisPointer", xAxisPointer);

		// 创建Y轴
		Axis yAxis = this.createValueAxis("厘米", false);

		// yAxis.setMax(200);

		// 设置Y轴数据显示格式
		Map<String, Object> axisLabel1 = Maps.newHashMap();
		axisLabel1.put("formatter", "{value} 厘米");
		yAxis.setPropValue("axisLabel", axisLabel1);

		// Y轴设置最小刻度
		yAxis.setPropValue("minInterval", 1);

		// Y轴指示器属性
		Map<String, Object> yAxisPointer = Maps.newHashMap();
		yAxisPointer.put("show", true);
		yAxisPointer.put("type", "line");

		// Y轴文本标签设置
		Label yAxisLabel = new Label();
		yAxisLabel.setShow(true);
		yAxisLabel.setBackgroundColor("black");
		yAxisPointer.put("label", xAxisLabel);

		// Y轴设置指示线类型
		Map<String, Object> lineStyle = Maps.newHashMap();
		lineStyle.put("type", "dotted");
		yAxisPointer.put("lineStyle", lineStyle);

		// 设置Y轴不触发悬浮提示信息
		yAxisPointer.put("triggerTooltip", false);

		yAxis.setPropValue("axisPointer", yAxisPointer);

		// 刷新图表
		customchart.refresh();
	}

	/**
	 * void</br>
	 *
	 * <p>Title: </p>
	 * <p>
	 *    Description:
	 *    创建柱状图series
	 * </p>
	 * <p>Copyright: Copyright (c) 2020</p>
	 * @author xx
	 * @date 2020年3月11日
	 * @param param the bare_field_name
	 * @return the bare_field_name
	 * @param group
	 * @param data
	 * see_to_overridden
	 * @version 1.0
	 */
	private void createBarSeries(Group group, List<Number> data) {
		// TODO Auto-generated method stub
		BarSeries barSeries = this.getMainChart().createBarSeries(group.groupName);

		// 设置标签值
		Label label = new Label();
		label.setBackgroundColor("#0000FF");
		label.setShow(true);
		// 设置位置为insideRight
		label.setPosition(Position.insideRight);
		// series[i]-bar.label.fontSize 文字的字体大小[ default: 12 ]
		// label.setFontSize("10");
		barSeries.setLabel(label);

		/**
		 * 不设置柱宽度 让其随类目宽度自适应
		 */
		// 设置柱宽度
		// barSeries.setBarWidth("25px");

		// 设置柱颜色
		barSeries.setColor(group.color);
		// 设置类别展示类型
		barSeries.setType(group.chartType);
		// 动画过度时间
		barSeries.setAnimationDuration(2000);
		// 设置相同的stack会堆叠显示
//		 barSeries.setStack("stack");
		// 设置所属坐标轴
		barSeries.setPropValue("yAxisIndex", group.yAxisIndex);
		// 设置类别对应的数据包
		barSeries.setData((Number[]) data.toArray(new Number[0]));

	}

	/**
	 * List<String></br>
	 *
	 * <p>Title: </p>
	 * <p>
	 *    Description:
	 *    获取每个物料的名称
	 * </p>
	 * <p>Copyright: Copyright (c) 2020</p>
	 * @author xx
	 * @date 2020年3月11日
	 * @param param the bare_field_name
	 * @return the bare_field_name
	 * @return
	 * see_to_overridden
	 * @version 1.0
	 */
	private List<String> getMateriaName() {
		List<String> materiaName = new ArrayList<>();
		materiaName.add("手机");
		materiaName.add("电脑");
		materiaName.add("桌子");
		return materiaName;
	}

	/**
	 * Map<Group,List<Number>></br>
	 *
	 * <p>Title: </p>
	 * <p>
	 *    Description:
	 *  获取主数据
	 * </p>
	 * <p>Copyright: Copyright (c) 2020</p>
	 * @author xx
	 * @date 2020年3月11日
	 * @param param the bare_field_name
	 * @return the bare_field_name
	 * @param materiaName
	 * @return
	 * see_to_overridden
	 * @version 1.0
	 */
	private Map<Group, List<Number>> getData02(List<String> materiaName) {
		// TODO Auto-generated method stub
		Map<Group, List<Number>> summaryResult = new LinkedHashMap<Group, List<Number>>();
		// 得到默认groups
		List<Group> groups = this.getDefaultGroups();

		// 给每个分组添加根据日期添加默认数据值
		List<Number> list01=new ArrayList<>();
		list01.add(10);
		list01.add(100);
		list01.add(70);
		summaryResult.put(groups.get(0), list01);

		List<Number> list02=new ArrayList<>();
		list02.add(15);
		list02.add(80);
		list02.add(130);
		summaryResult.put(groups.get(1), list02);

		List<Number> list03=new ArrayList<>();
		list03.add(20);
		list03.add(120);
		list03.add(200);
		summaryResult.put(groups.get(2), list03);

		return summaryResult;
	}

	/**
	 * Group</br>
	 *
	 * <p>Title: </p>
	 * <p>
	 *    Description:
	 * 根据xingqi来匹配分组 从而加入对应的数据
	 * </p>
	 * <p>Copyright: Copyright (c) 2020</p>
	 * @author xx
	 * @date 2020年3月11日
	 * @param param the bare_field_name
	 * @return the bare_field_name
	 * @param groups
	 * @param ren
	 * @return
	 * see_to_overridden
	 * @version 1.0
	 */
	private Group matchGroup(List<Group> groups, String ren) {
		// TODO Auto-generated method stub
		for (Group group : groups) {
			if (StringUtils.equals(group.groupKey, ren)) {
				return group;
			}
		}
		return null;
	}

	/**
	 * Axis</br>
	 *
	 * <p>Title: </p>
	 * <p>
	 *    Description:
	 *    创建类目型坐标轴
	 * </p>
	 * <p>Copyright: Copyright (c) 2020</p>
	 * @author xx
	 * @date 2020年3月11日
	 * @param param the bare_field_name
	 * @return the bare_field_name
	 * @param name 坐标轴名称
	 * @param isX 是否X轴,ture创建X轴,false创建Y轴
	 * @return
	 * @version 1.0
	 */
	private Axis createCategoryAxis(String name, boolean isX) {
		Axis axis = null;
		if (isX) {
			// X轴
			axis = this.getMainChart().createXAxis(name, AxisType.category);
		} else {
			// Y轴
			axis = this.getMainChart().createYAxis(name, AxisType.category);
		}
		// axis.setCategorys(x);
		// 坐标轴刻度相关设置
		Map<String, Object> axisTick = new HashMap<>();
		// 坐标轴刻度的显示间隔为0
		axisTick.put("interval", 0);
		// 坐标轴刻度设置为不显示
		// axisTick.put("show", true);
		// 设置坐标轴的属性-刻度
		axis.setPropValue("axisTick", axisTick);
		// 设置坐标轴轴线颜色
		this.setLineColor(axis, "#5F9EA0");
		return axis;
	}

	/**
	 * Axis</br>
	 *
	 * <p>Title: </p>
	 * <p>
	 *    Description:
	 *    创建值类型坐标轴
	 * </p>
	 * <p>Copyright: Copyright (c) 2020</p>
	 * @author xx
	 * @date 2020年3月11日
	 * @param param the bare_field_name
	 * @return the bare_field_name
	 * @param name 坐标轴名称
	 * @param isX 是否X轴,ture创建X轴,false创建Y轴
	 * @return
	 * @version 1.0
	 */
	private Axis createValueAxis(String name, boolean isX) {
		Axis axis = null;
		if (isX) {
			// X轴
			axis = this.getMainChart().createXAxis(name, AxisType.value);
		} else {
			// Y轴
			axis = this.getMainChart().createYAxis(name, AxisType.value);
		}

		// 坐标轴刻度相关设置
		Map<String, Object> axisTick = new HashMap<>();
		// 坐标轴刻度设置为不显示
		// axisTick.put("show", false);
		// 设置坐标轴的属性-刻度
		axis.setPropValue("axisTick", axisTick);

		//
		Map<String, Object> splitLine = new HashMap<>();
		Map<String, Object> lineStyle = new HashMap<>();
		// 分隔线的类型
		lineStyle.put("type", "dotted");
		// 分隔线的颜色
		lineStyle.put("color", "#E2E2E2");
		splitLine.put("lineStyle", lineStyle);
		// 设置坐标轴的属性-分隔线
		axis.setPropValue("splitLine", splitLine);
		// 设置坐标轴轴线颜色
		this.setLineColor(axis, "#5F9EA0");
		// 显示悬浮提示框
		this.getMainChart().setShowTooltip(true);
		return axis;
	}

	/**
	 * void</br>
	 *
	 * <p>Title: </p>
	 * <p>
	 *    Description:
	 *    设置坐标轴轴线的颜色
	 * </p>
	 * <p>Copyright: Copyright (c) 2020</p>
	 * @author xx
	 * @date 2020年3月11日
	 * @param param the bare_field_name
	 * @return the bare_field_name
	 * @param axix 坐标轴对象
	 * @param color 颜色色值
	 * @version 1.0
	 */
	private void setLineColor(Axis axix, String color) {
		Map<String, Object> axisLineMap = new HashMap<>();
		Map<String, Object> lineStyleMap = new HashMap<>();
		// 坐标轴轴线的颜色
		lineStyleMap.put("color", color);
		axisLineMap.put("lineStyle", lineStyleMap);
		// 设置坐标轴的属性-轴线
		axix.setPropValue("axisLine", axisLineMap);
	}

	/**
	 * HistogramChart</br>
	 *
	 * <p>Title: </p>
	 * <p>
	 *    Description:
	 * </p>
	 * <p>Copyright: Copyright (c) 2020</p>
	 * @author xx
	 * @date 2020年3月11日
	 * @param param the bare_field_name
	 * @return the bare_field_name
	 * @return
	 * @version 1.0
	 */
	private HistogramChart getMainChart() {
		return (HistogramChart) this.getControl("histogramchartap");
	}

	/**
	 * List<Group></br>
	 *
	 * <p>Title: </p>
	 * <p>
	 *    Description:
	 *    默认的类别分组
	 * </p>
	 * <p>Copyright: Copyright (c) 2020</p>
	 * @author xx
	 * @date 2020年3月11日
	 * @param param the bare_field_name
	 * @return the bare_field_name
	 * @return
	 * @version 1.0
	 */
	private List<Group> getDefaultGroups() {
		List<Group> defaultGroupList = new ArrayList<>(4);
		defaultGroupList.add(new Group("长度", "length", "#3CB371", true, ChartType.bar, 0));
		defaultGroupList.add(new Group("宽度", "width", "#FF0000", true, ChartType.bar, 0));
		defaultGroupList.add(new Group("高度", "height", "#FFCC00", true, ChartType.bar, 0));

		return defaultGroupList;
	}

	class Group {
		// 组名
		String groupName;
		// 组别key
		String groupKey;
		// 组别显示颜色
		String color;
		// 是否选中
		Boolean selected;
		// 展示类型,柱形、折线等等。
		ChartType chartType;
		// 所属轴标识,这里只用到了多个Y轴,故只设置了Y轴标识
		Integer yAxisIndex;

		public Group(String groupName, String groupkey, String color, Boolean selected, ChartType chartType,
				Integer yAxisIndex) {
			this.groupName = groupName;
			this.groupKey = groupkey;
			this.color = color;
			this.selected = selected;
			this.chartType = chartType;
			this.yAxisIndex = yAxisIndex;
		}
	}
}
- 重启服务器后注册插件预览测试,如下图所示测试成功
分割线
相关信息
以上就是我关于 金蝶云苍穹柱状图样例 知识点的整理与总结的全部内容,希望对你有帮助。。。。。。
Powered by Waline v2.15.4